High Speed Rail
Visualization reimagining the future of travel
Drew King, Joey Krueger, Jack Rosenbloom
Visualization reimagining the future of travel
Drew King, Joey Krueger, Jack Rosenbloom
Team Members

Drew King
(They/Them)

Joey Kreuger
(He/Him)

Jack Rosenbloom
(He/Him)
Demo Video
We created a video for the High Speed Rail project to showcase public opinion, why it's important, the conceptual trainbuilder and how we are visualizing this data.
Project Contributions
- Joey Kreuger: Created the force directed graph visualization for public opinion data collected from reddit r/transit.
- Jack Rosenbloom: Created the styles for the project.
- Drew King: Created the train builder concept that Dan Sutton proposed including the data visualization and the data prep.
Conceptual Train Builder for High-Speed Rail
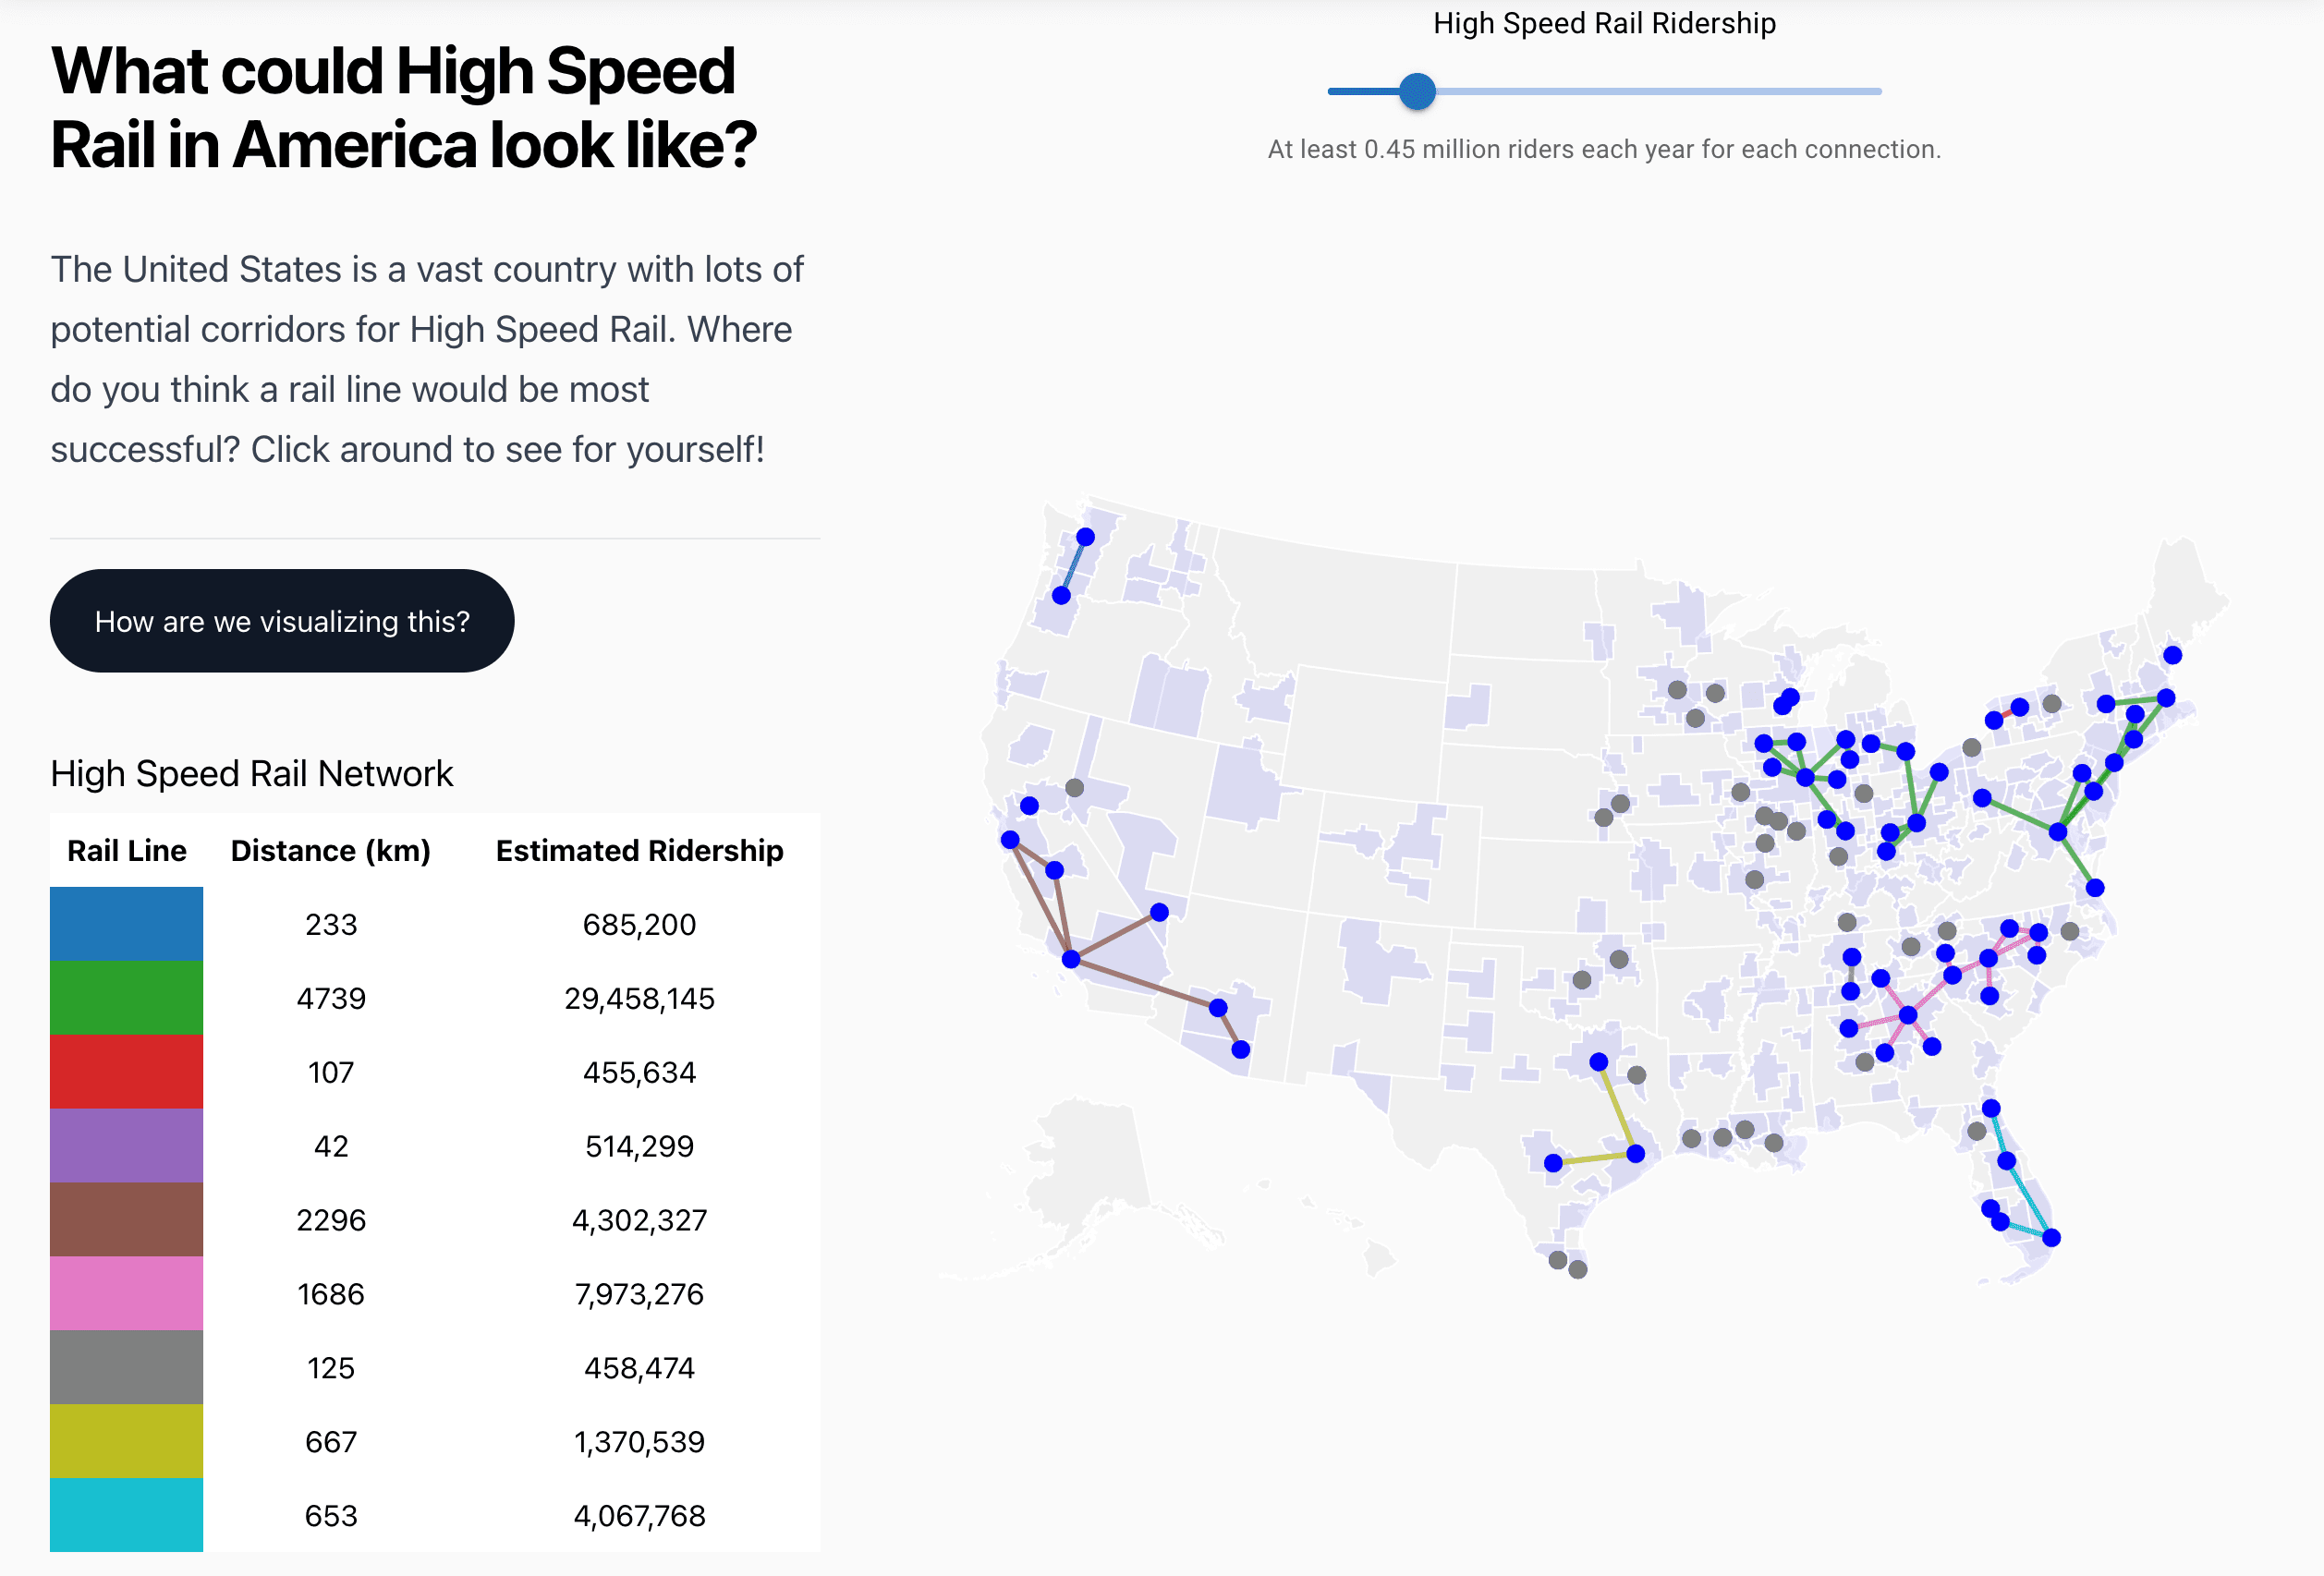
The High Speed Rail project includes a conceptual train builder I built for a high-speed rail system in the United States. The goal of the project is to provide a fast, efficient, and sustainable mode of transportation that connects major cities across the country. The project envisions a network of high-speed trains that travel at speeds of up to 300 miles per hour, making it possible to travel between cities in a matter of hours. We estimated the ridership by analyzing the population density and distance between major cities in the United States.
Designing the System
This data visualization shows the proposed high-speed rail routes connecting major cities in the United States. The routes are color-coded based to indicate groups of connected cities.
High Speed Rail Ridership
0.45 million riders per year.High Speed Rail Network
| Rail Line | Distance (km) | Estimated Ridership |
|---|
Benefits of High-Speed Rail
High-speed rail offers several benefits over other modes of transportation, including:
- Speed: High-speed trains can travel at speeds of up to 300 miles per hour, making them faster than cars and airplanes for short to medium-distance trips.
- Efficiency: High-speed rail is more energy-efficient than cars and airplanes, making it a more sustainable mode of transportation.
- Convenience: High-speed rail stations are located in city centers, making them more convenient to access than airports.
The Future of Travel
The High Speed Rail project is a vision for the future of travel in the United States. By providing a fast, efficient, and sustainable mode of transportation, high-speed rail has the potential to transform the way we travel and connect with each other.
How was this project built?
Data Prep
This project was built by me from a concept Daniel Sutton created by using React, D3, React, and QGIS. The map was created using QGIS, an open-source geographic information system, to visualize the train routes and cities and exported as a TopoJSON file. The data was prepared using R to create a list of combined statistical areas (CSAs), their populations, the most populous city in each CSA, and the distance between the most populous city and the other most populous cities in other CSA's.
Development
The project was built using React, a JavaScript library for building user interfaces, and styled using Tailwind CSS. The data visualization was created using D3.js, a JavaScript library for creating interactive data visualizations. Behind the scenes, the project uses a combination of React hooks and context to manage the state of the application and pass data between components. The data is managed by a graph data structure that represents the train routes and cities, and the visualization is updated in real-time as the user interacts with the map.
Deployment
The original High Speed Rail project was deployed to gitlab pages with additional visualizations created by Joey Kreuger and styles by Jack Rosenbloom. We used a custom build script to generate the static files and deploy them to a web server using GitLab CI/CD.
The Train Builder has been redeployed to this site for demonstration purposes using the same build script, modified for use with Next.js and deployed using Vercel. The code for this visualization can be found on my github inside of my portfolio repository.